
Policy Proposals to Address Chronic Absenteeism (Pt 1)
[Jan 17 2023: This post has been updated to better reflect the relationship between attendance and state funding for public schools.]
Richmond heads into budget season next week, and boy does it have a problem.
We have $2B in infrastructure needs we cannot meet, we’re hemorrhaging educators that we (and the state; country) have failed to meaningfully invest in for… my entire lifetime, and we are meeting none of our district’s academic, graduation, or accreditation goals. Each of these areas demand significant investment, at the same time that spike in chronic absenteeism jeopardizes state funding.
Let me explain: Virginia funds it’s public schools based on “Average Daily Membership” (ADM) - or, the average number of students enrolled in a district over a given period of time. Including students who are absent.
However, chronic absenteeism is a reliable indicator of drop-out. In fact, by middle and high school, it is the “leading warning sign that a student will drop out.” I do not have those numbers for RPS, but this (2012, Utah) study quantifies the strong connection between absenteeism and enrollment:
“More than 25 percent of the seniors who had been chronically absent at some point between their 8th grade and junior year dropped out of high school.”
Perhaps this explains the “very concerning” impact of chronic absenteeism on the ADM that RPS Chief of Staff, Michelle Hudacsko acknowledged in the last Board meeting.
If this is the case, then chronic absenteeism is the canary in the coal mine, foretelling a (potentially dramatic) drop in student enrollment.
If our rates of absenteeism remain high - and our dropout rate rises with it - we’ll see a significant decline in state funding. Further undermining our efforts to educate our kids, attract/retain talent, and maintain our facilities.
The long-term success success of our district (and the students themselves) relies on getting kids back to school.
Intro to Chronic Absenteeism
Students are considered “chronically absent” when they miss 10% or more of their classes. (In Richmond, this is about 15 days.) This count includes “excused absences, unexcused absences, and suspensions.”
The absenteeism rate is high in America (17%), across Virginia (20%), and especially high in Richmond Public Schools (25.9% to-date).
For the most part, these absences are a reflection of socio-economic status. This is supported by over a decade of research that finds students often miss school at no fault of their own.
They don’t have reliable transportation.
They don’t have stable housing.
They don’t have access to (or funding for) medical care when they get sick.
They don’t have access to (or funding for) mental health care.
They don’t have caregivers who can get them to school if they miss the bus, or take off work when they need medical attention; And,
They are students under economic pressure to enter the workforce.
These structural barriers to student attendance - in Richmond, Virginia, and across the Country - are well outside of the control of any School Division, or their supervising School Boards. Absenteeism is persistent and pervasive because it reflects broader societal failures and inequities. It’s the public transportation we didn’t invest in, the housing vouchers we didn’t provide, or the job opportunities we failed to attract. Absenteeism is elevated because the pandemic has worsened these inequities. The only way we get to 0% absenteeism anywhere is if our larger governing bodies address these root causes.

That doesn’t mean that School Divisions are off the hook, though. They can inch the absenteeism rate up or down by doing things like maintaining a reliable fleet of school buses (or not); or enforcing mask use during a surge of RSV or flu. (Of course, it helps to have the funding to do so, and the support/compliance of the general public.)
RPS’ absenteeism rate is undeniably high (25.9% to-date). What we don’t know is what portion of that number reflects our “economically disadvantaged” student population - and what portion reflects RPS policies and practices?
I took to the VDOE website to find out.
For the exercise below, I use raw enrollment data and chronic absentee reports. I put it together in this chart. I didn’t want to make y'all's heads explode, though, so I share my findings in a series of pretty graphics below.
Absenteeism and Economic Condition
In 2018, RPS’ new administration adopted a strategic plan (Dreams4RPS) to bring Richmond student’s absenteeism in line with the State average by 2021-2022. This goal was 10% chronic absenteeism, and we did not meet it.
Instead, RPS reports that chronic absenteeism nearly doubled, hitting 27.7% in 2021-2022.
We can credit the global pandemic for much of that. But honestly, meeting the state average was a lofty goal to begin with. That’s because rates of Chronic Absenteeism go hand-in-hand with economic status, remember? And Richmond’s student body is considerably more economically disadvantaged than Virginia as a whole.

The most reasonable comparison, then, is to use the state averages by economic subgroup, and apply them proportionally to RPS’ student demographic. I call this the “weighted state average,” and I use the following 3 sub-groups to determine this number:
“Advantaged” students. (Anyone the VDOE hasn’t labeled as “economically disadvantaged”)
“Disadvantaged” students. (Anyone the VDOE labels as “economically disadvantaged”); And,
“Homeless” students. (Anyone the VDOE labels as “Homeless”) Note: homelessness is not a direct measure of economic status, but it is correlated. And, because this sub-group has the most alarming rate of absenteeism, it felt like erasure to omit them in this discussion. Extreme economic stress has an extreme(ly negative) impact on school attendance.
These are all imperfect labels for a lot of reasons, but they do make it a lot easier to read the charts and graphs I’ve made up. Thanks for understanding!

You can see here the dramatic increase in absences unhoused students rack up.

If each of RPS’ student sub-groups had met the state’s average in 2021-22, we would expect to see an absenteeism rate of 22.9%.
So why did RPS report a Chronic Absenteeism rate that was 4.8% higher? Are our school division’s policies or practices to blame? We need to both rewind and zoom out to find out.
Absenteeism and RPS Policy
Let’s take a trip down memory lane:
In 2015-16, Bedden’s RPS reported a 20.8% rate of chronic absenteeism.
The Virginia average that year was 10.4%.
The “weighted” state average says RPS should have been more like 13.09%. The Bedden Administration underperforms that number by 7.71%. Yikes.
This was also a time when RPS had stopped enforcing their attendance requirements for graduation. It was a mess, which the Kamras administration cleaned up years later. But that’s a story for another time.
In 2018, the Kamras Administration reported a remarkable decrease in absenteeism. RPS closed out the year at 14.8%. We still underperformed the State average (10.6%) and the weighted state average (13.01%) but only by 1.79%. That’s significant progress!

The strategies used then (“Attendance Teams” and “Intervention Plans”) sound remarkably similar to those we’re still using in RPS today (“TRIO” teams and “Family Success Plans”). Which suggests that - as terrible as our current numbers are - they’d be even worse without these strategies. They do work. But our progress was cut short by the pandemic.
Still, the 1.79% gap we saw in 2018 is incredibly relevant. There are a few things we can attribute it to:
Maybe there’s a limit to the success of the administration’s “compassion-only” strategy? In which case, we may need to supplement them with enforcement strategies as well.
Maybe we need to double down - and significantly expand our current compassionate, relationship-building efforts.
Maybe there are other policies - specifically related to school calendars, start times, and transportation - that are interfering with student attendance.
Or, maybe there are regional barriers we’ve not yet considered. Is meeting - or exceeding - the state average even possible for the greater Richmond area? If so, why? Let’s zoom out and see what we can learn from regional trends.
Regional Performance
Turns out: over-performing the state average in the Richmond region is possible. We know this because all of our neighboring school systems do it. Here is the actual rate of absenteeism for each, alongside their weighted state average.
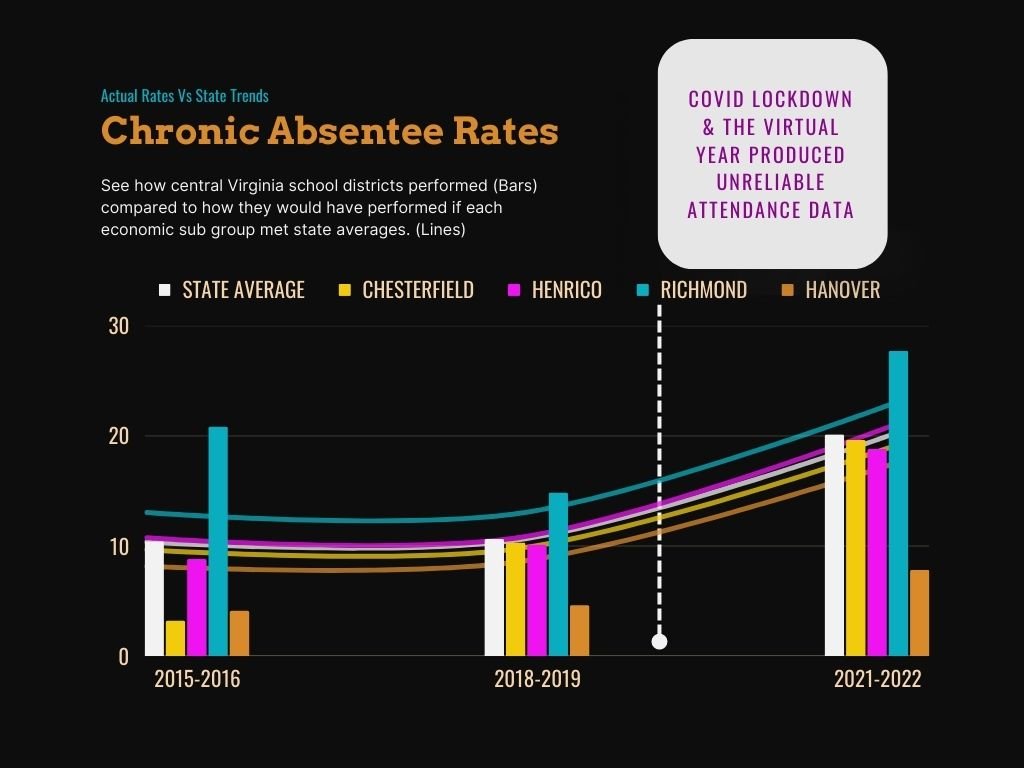

Between 2015 and 2022, Chesterfield and Henrico report a pretty “average” performance.
But Hanover blows us all out of the water. They consistently over-perform both their weighted state average, and the total state average. Especially post-pandemic. Either they’re cooking the books and fudging their attendance records, or there is something about their policies that keep student attendance high.
It’s also worth noting that Hanover’s student body is more advantaged than the state as a whole, and all of these districts are more advantaged than Richmond:

Regional Policy Impacts on Chronic Absenteeism
There’s an elephant in the data, and his name is “Pandemic-Related School Closures.” As far as education policies go, this one was the most disruptive. And what we see across the region is that school absenteeism today reflects how long schools stayed closed:
Hanover didn’t close their schools at all in 2020-2021. They opened in the Fall, and never experienced the drop in participation that schools across the country did.
Chesterfield and Henrico began a hybrid re-opening plan in October and November (respectively) for their most vulnerable students - with a broader reopening in the Spring of 2021. This was the most common reopening strategy seen across Virginia, which could be why their initial drop in student participation, and their rebound rate, are also “average.”
Richmond was the only school in the region that remained virtual throughout 2020-21. Our student attendance dropped well below the state average. We’re not even sure how low - because Google Classroom data likely underreported student absences. (If a student logged in, they were considered present… even if they had a meltdown 4 minutes into class, slammed their chromebook shut and ran into their sister’s nursery to cry tears of frustration.) Sadly, RPS, with our limited resources, is still struggling to recover.

We acted in an abundance of caution, expecting in-person schooling would cause a surge in covid cases. Many even pointed to the turbulence of reopening during a Delta surge and thought they were right. But we have the benefit of hindsight now, and global evidence proves that schools did not become Covid super-spreaders. (H/T to Nurse Emily)
What we did get, though, was an unprecedented decline in student mental health. These impacts were the worst for Black, Hispanic, and low-income students - which make up about 60% of Richmond students. My fear - looking at the absentee data - is that those impacts increased the longer schools stayed closed.

I want to be clear here: I was a scared mom of a 5 month old and 2 vaccine-ineligible elementary school students when RPS first made this policy decision. My bestie Emily was providing in-home end of life care for an elderly family member dying of COVID.
Lots of families had unique circumstances and fear surrounding COVID.
I supported virtual learning. But “the numbers are the numbers.” And they suggest our current attendance crisis is due, in part, to the Board and Administration’s decision to extend remote learning months beyond the rest of the state.
RPS over-reacted. Their closures caused a surge of emotional trauma, and that trauma appears to be biting us in our school attendance rates now. This is a whole other Deep-Dive, which you can find in Part 2.
If this is true, then we cannot solve chronic absenteeism until we solve the student mental health crisis.
Local Policy Impacts on Chronic Absenteeism
We can’t undo our virtual year - but there is one current policy that could be causing problems. Let’s break down the absentee data by grade.
In 2021-2022, RPS changed its bell schedule. We switched the school start order from High-Middle-Elementary, to Elementary-Middle-High.
For years, there’s been a growing body of research suggesting High Schoolers perform better academically when they get to sleep in. I am NOT a morning person, so I can very much relate. Given RPS’ struggles to meet graduation targets, this seems like a pretty reasonable switch, right?
Well. Maybe. Except it turns out elementary school students are far more truant when they have to wake up early and catch a bus at 7AM.


Ignore the numbers for a second. (Remember, there’s a pandemic impact that inflated absences everywhere.) Instead, compare the shape of the line graph from 2018 (Old Bell Schedule) and 2021 (New Bell Schedule).
There is a less dramatic spike in High School truancy, but the bell schedule “solution” appears to have dramatically increased absentee rates for elementary schoolers.
My prediction is - as districts in California and New Jersey experiment with pushing high school start times later like we did, there’s going to be a slew of studies popping up saying early start times are detrimental to elementary schoolers’ academic success, too.
That doesn’t mean every school district will feel this pain the same. Our neighbors to the north pull off the Elementary (8AM), Middle (8:45AM), High (also 8:45AM) sequence without the surge in absenteeism among their elementary schoolers.

They are, however, significantly more advantaged than RPS. A kid who misses the bus is more likely to have a caregiver who can get them to school.
Hanover also serves a significantly more “advantaged” population, and disproportionately benefits from the state funding funding formula in a way our urban district does not.. This probably means they have money in the bank to maintain a larger fleet of buses. (My investigation here didn’t take me that far, but if someone knows that info, I’d love to see it.) More buses means shorter routes, which allows for less of a gap between school start times.
Unfortunately, RPS’ bus count took a hit last year. I can’t recall offhand if we’ve been able to replace them, but I doubt this event has left us in the position to buy even more. And while we’ve managed to attract a lot of drivers by offering the most competitive pay in the region, I do not know that we have enough drivers to make use of a larger fleet.
Back to Chronic Absenteeism, and maximizing the State’s contribution. If absences hurt our enrollment, which hurts our State revenue, then RPS would benefit from whichever bus schedule gets the most butts in seats. In a pure numbers game, it “pays” to put Elementary School back in the 9AM slot.

Either way, the School Board and Administration have some tough decisions to make, and each option has clear winners and losers. I do not envy them.
Conclusion
To solve the absenteeism crisis:
RPS needs to solve the mental health crisis. (I break this down by policy in Part 2.) And,
RPS either needs to build up its fleet of buses so that all grade levels can start later in the morning, or they need to bump High Schoolers from the 9AM slot until they have the funding to support a later start time for Elementary School.
This has been QUITE the data-dump, so maybe put your shoes on and take the dog for a walk? Clear your head a bit, then set a reminder to come back and read Part 2 with your morning coffee tomorrow. I’m sort of in love with it, so I hope you’ll make a point to read it, too.
Thanks as always for your support and staying involved in local government. Public schools need all the advocates they can get!